

What's on this page
- Why waste is already inside your food cost percentage
- The arithmetic that makes waste worth chasing
- Before you start
- Step 1: Measure the waste before you change anything
- Step 2: Separate the three waste streams
- Where the waste dollars actually sit
- Step 3: Fix ordering and par levels
- Step 4: Fix receiving and storage
- Step 5: Fix prep with yield testing and batch sizing
- Step 6: Use the trim deliberately
- Step 7: Cut plate waste at the portion
- Step 8: Hold the gains with a weekly waste log
- Where the sales dollar goes when waste is visible
- A worked example: one month end to end
- What each fix is worth
- Equipment as a waste lever
- The food safety line you should not cross alone
- Donation and diversion as a route, not a promise
- Waste and the prime cost trade
- Common mistakes when cutting food waste
- Troubleshooting: what if the number will not move
- Your food waste checklist
- The bottom line
Short answer: Cut restaurant food waste in eight steps: measure for two weeks before changing anything, separate spoilage, prep waste, and plate waste, fix ordering and par levels, fix receiving and storage, fix prep through yield testing and batch sizing, use the trim on purpose, cut plate waste at the portion, then hold the gain with a weekly log. Every dollar of waste removed is a dollar of profit at full value.
Cutting restaurant food waste comes down to eight steps in a deliberate order: measure before you change anything, separate the three waste streams, fix ordering and par levels, fix receiving and storage, fix prep through yield testing and batch sizing, use the trim on purpose, cut plate waste at the portion, then hold the gain with a weekly log. Work them in that order and the waste line stops being a vague sustainability ambition and becomes a specific number on your profit and loss that you can move.
The reason waste is so often left alone is that it does not appear as its own line anywhere. It is already inside the food cost percentage, buried in cost of goods sold, indistinguishable from the food that reached a paying guest. Our walkthrough on how to calculate restaurant food cost builds that percentage from inventory counts, and its labor twin, restaurant labor cost percentage, covers the other half of prime cost. This walkthrough works the operational lever on the food half, runs one illustrative month end to end, and flags the mistake hiding in each step. Run your own figures alongside it in the companion calculator as you read.
Key takeaways
- Waste is already inside your food cost percentage. A restaurant reading 32% food cost with waste worth 6% of sales is really running a 26% food cost badly, not a 32% food cost well.
- Every dollar of waste removed is a dollar of profit at full value, while a dollar of new sales only earns profit at your net margin. At an illustrative 2% margin, $3,000 of recovered waste equals $150,000 of extra monthly sales.
- Three streams need three different fixes: spoilage is an ordering problem, prep and trim waste is a recipe and batching problem, and plate waste is a portion and menu problem.
- Measure for two weeks before changing anything. Most kitchens guess wrong about which stream is largest, and fixing the wrong one costs labor hours and returns nothing.
- Nothing holds without a weekly waste log and a stated target. Waste reverts the moment it stops being counted, which is why the last step matters as much as the first.
Why waste is already inside your food cost percentage
Food cost percentage is built from cost of goods sold, and cost of goods sold is beginning inventory plus purchases minus ending inventory. Read that formula carefully and the implication is unavoidable: anything that left your inventory is in the numerator, whether a guest paid for it or a porter carried it to the bin. The percentage cannot tell the two apart.
That is why an operator staring at a 32% food cost so often reaches for the wrong lever. The instinct is to reprice the menu or squeeze a supplier, because those are the levers that look like they act on food cost. But if waste is worth 6% of sales, then only 26 points of that 32 are food that reached a paying guest. The remaining six points are not a pricing problem at all. They are an operations problem wearing a pricing problem’s clothes.
Splitting the number this way is the entire reframe. It converts a percentage you feel judged by into two separate quantities: the cost of feeding your guests, which your recipes and your suppliers set, and the cost of not feeding them, which your kitchen habits set. Only the second one is free to fix. Our breakdown of how to price a restaurant menu handles the first. This article handles the second.
The practical test is simple. Before you raise a price or renegotiate a case cost, ask whether you know what your waste is worth. If you do not, you are pricing around a number you have never measured, and the increase will be absorbed by the same leak that made the increase feel necessary.
The arithmetic that makes waste worth chasing
Here is the illustrative restaurant this walkthrough uses throughout. Monthly food sales of $100,000 across 4,000 covers, a $25 average check. Food cost of 32%, so $32,000 of cost of goods sold. Fully loaded labor of 36%, or $36,000. Occupancy, utilities, insurance, marketing, repairs, supplies and processing fees together at 30%, or $30,000. What is left is a 2% net margin, $2,000 a month.
Now add the waste measurement. Suppose two weeks of weighing says waste is worth 6% of food sales, $6,000 a month. That is $1.50 of binned food for every one of the 4,000 covers, and about 19 cents of every dollar of food purchased. Six points of waste against a two point margin means the restaurant throws away three times its entire monthly profit.
The leverage comes from where the recovered dollar lands. Remove a dollar of waste and you remove a dollar of cost, and with no other cost moving, that dollar is profit. Add a dollar of sales instead and you keep two cents of it. So recovering $3,000 a month, half the waste, is worth the same to the bottom line as adding $150,000 in monthly sales, two and a half times the restaurant’s existing volume. Even at a healthier illustrative 5% margin, matching it would take $60,000 of new sales a month.
One honest caveat keeps that from being a magic trick. Removing waste consumes labor: yield tests, tighter ordering, more frequent counts, someone filling in the log. Net the recovery against those hours, and our coverage of restaurant profit margin shows why the netting matters. All figures here are illustrative.

Before you start
This is a measurement project before it is a change project, and the prerequisites are modest. You need a scale that reads in the unit you buy in, a place to write things down that sits within arm’s reach of the bin, and agreement from whoever runs the line that the logging is part of the job rather than a favour.
You also need your own food cost percentage for a recent full period, because the waste number only means something next to it. If you do not have one, run that calculation first, since the whole reframe in this article depends on being able to say “of my X points of food cost, Y points never reached a guest.”
Here is what to have lined up before step one:
- A digital scale at the prep station and a second one by the dish pit, reading in pounds or kilograms to match how you buy.
- A waste log sheet on a clipboard, with four columns: item, weight, stream, reason. Paper is fine and often better than an app nobody opens.
- Your purchase costs per unit, so a weight can be converted to a dollar value at what you paid rather than at menu price.
- A recent food cost percentage for a full period, calculated from real inventory counts on both ends.
- Two weeks of patience before you change anything, plus a standing fifteen minute weekly slot to read the totals.
Time and difficulty: about ten minutes a day of logging during the measurement fortnight, then roughly an hour a week to total, review and act. The difficulty is low. The failure mode is not complexity, it is abandonment, which is exactly what the eighth step exists to prevent.
Step 1: Measure the waste before you change anything
Do nothing differently for two weeks. Weigh everything that goes in the bin, write down what it was, which stream it came from, and why. Resist every urge to fix what you see while you are measuring, because a baseline you improved halfway through is not a baseline.
The mechanics: put a scale and a tared bin at each waste point, one at the prep bench and one at the dish pit. Every time something is discarded, it goes on the scale first. The person who discarded it writes the item, the weight, the stream and a one-word reason. Convert weights to dollars at your purchase cost, not at menu price, because the money you actually lost is what you paid for it.
Two weeks rather than one, because a single week can be distorted by one bad delivery, one slow Tuesday, or one cook on holiday. Two weeks smooths that enough to act on while still being short enough that people stay with it.
Worked number: in the illustrative restaurant, two weeks of logging totals $2,770 of binned food value, which annualises to roughly $6,000 a month against $100,000 of monthly food sales, so waste is worth about 6% of sales. Set that as the baseline and write it on the wall.
Watch out: the log will under-report in week one, always. People forget, or quietly bin the embarrassing item. Do not treat week one as your number, and do not use the log to discipline anyone, or it will stop being accurate the same day you do.
Step 2: Separate the three waste streams
A single waste total tells you that you have a problem. It does not tell you what to do, because the three streams have nothing in common except the bin they share.
Spoilage is food that was bought and never used: produce softening in the walk-in, dairy past date, protein with freezer burn, dry goods damaged or forgotten. The key insight is that spoilage is bought, not created. By the time it spoils, the decision that caused it was a purchase order placed a week earlier. Fixing it means fixing ordering, not fixing the kitchen.
Prep and trim waste is created in the kitchen: peel and trim beyond what the recipe assumes, batches cooked larger than demand, product mishandled or dropped, remakes. This is a recipe, yield and batching problem, and it responds to yield testing and honest batch sizing.
Plate waste is food that reached a guest and came back. This one is feedback, not fault. When the same component consistently returns half eaten, the portion is wrong, the dish is wrong, or the pairing is wrong, and the guest has already told you so at the cost of the food.
In the illustrative restaurant, the $6,000 splits roughly $2,700 spoilage, $2,100 prep and trim, and $1,200 plate waste, or 45%, 35% and 20%. Those shares are illustrative. Your own two weeks will produce a different split, and the split is the whole point of the exercise.
Watch out: do not let one stream get coded into another. Product that spoiled because it was over-prepped is prep waste, not spoilage, and the distinction changes which fix you reach for.
Where the waste dollars actually sit
Splitting the three streams into their specific line items is what turns a total into a work order. The bars below break the illustrative restaurant’s $6,000 of monthly waste value into seven sources, with each bar’s width drawn from its value as a share of the largest.
Where $6,000 of monthly food waste value comes from
The illustrative restaurant's waste log, valued at purchase cost. Bar width is each source as a share of the largest.
The three streams total $2,700 of spoilage (walk-in produce and dairy, protein, dry goods), $2,100 of prep and trim waste (over-prepped batches, trim above yield, line drops), and $1,200 of plate waste. Two thirds of the money is bought rather than created, which is why ordering and storage come before knife technique. All figures are illustrative and your own log will produce a different shape.
The lesson in the chart is proportional rather than absolute. Whatever your own totals are, the top two or three lines almost always carry most of the money, and working them first is worth more than a general campaign to be careful. A kitchen that fixes its largest line and ignores the rest will beat a kitchen that tries to fix everything at once.
Step 3: Fix ordering and par levels
Most spoilage is bought. That single sentence reorders the whole project, because it means the largest waste stream is fixed at a desk with a purchase order, not at a bench with a knife.
The mechanics: for each high-spoilage item, work out actual usage per week from your inventory counts and your waste log, then compare it to the par level you are ordering to. The gap between them is the food you are buying to spoil. Reset the par to actual usage plus a deliberate buffer sized to your delivery frequency and the item’s shelf life, not to the buffer that made someone comfortable three years ago.
Worked number: a produce item ordered to a par of 12 cases a week where real usage is 9 cases means 3 cases sitting long, of which roughly one spoils. At an illustrative $30 a case that is $30 a week, about $130 a month, from one line item. Repeat across the produce list and you can see where $1,600 a month comes from.
Order more often in smaller quantities where the supplier and your delivery schedule allow it. Short-dated, high-spoilage items are the ones that reward frequency most, and shelf-stable dry goods are the ones that reward it least.
Watch out: smaller and more frequent is not automatically cheaper. Case-break pricing, minimum order values and delivery fees can eat the saving, and a stockout mid-service costs more than the spoilage you avoided. Price the change before you make it, and protect the items you genuinely cannot run out of.
Step 4: Fix receiving and storage
Between the delivery door and the prep bench, a well-ordered case can still become waste. This step is about the handling that decides whether the food you bought correctly survives to be cooked.
Receiving comes first, and it is the cheapest control in the building. Check temperature on arrival for anything that needs it, check dates, check condition, and refuse what does not meet the standard rather than accepting it and hoping. Product accepted short-dated is product you have already committed to waste. Credit for a rejected case is easier to obtain at the door than a week later.
Rotation is the next control. Oldest forward, newest behind, without exception, and the rule only survives if the physical layout makes it the easy option rather than the disciplined one. Labelling is what makes rotation possible: every container gets a label with what it is and the date it was made or opened, because an unlabelled container is a container someone will eventually bin on suspicion.
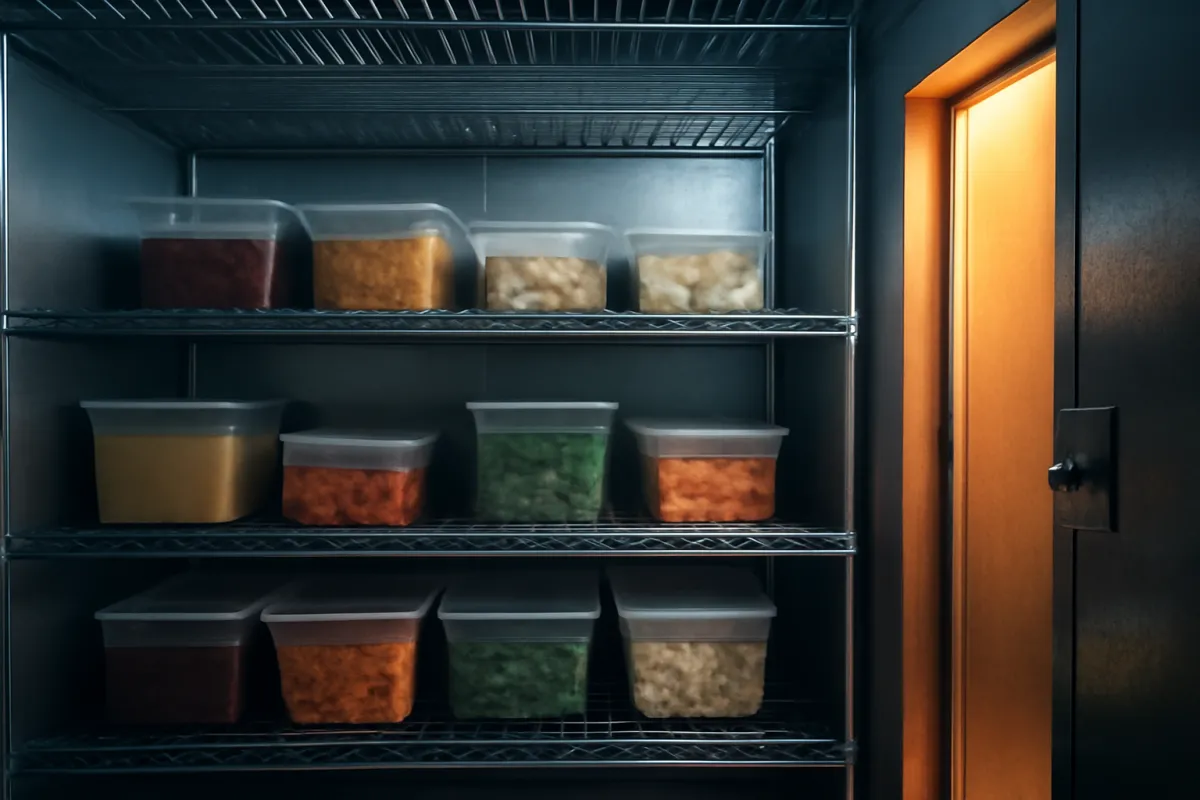
Then temperature and airflow. Walk-ins hold temperature only when air can move, so a unit packed to the walls runs warm in the middle regardless of what the dial says. Run a weekly walk-in audit: pull everything forward, check dates, note what is aging, and feed that list to whoever orders.
Watch out: holding temperatures, cooling procedures, date-labelling requirements and how long an opened product may be kept are set by your local health authority and vary by jurisdiction and product. Get your specific rules from your local health department or your food safety programme rather than from any article, this one included.
Step 5: Fix prep with yield testing and batch sizing
Prep waste has two causes and each has its own fix. The first is trim above what the recipe assumes, which yield testing exposes. The second is cooking more than the day needs, which batch sizing corrects.
A yield test is straightforward. Weigh a case as purchased, break it down exactly as your kitchen does, weigh what is usable, and divide. That percentage is your yield, and dividing your as-purchased cost by it gives the true cost of an edible pound. Worked number: a case at $30 for 20 pounds is $1.50 a pound as purchased. At a 70% yield, an edible pound costs $1.50 divided by 0.70, about $2.14. At an 80% yield it costs $1.88. On 1,500 edible pounds a month, that ten point yield improvement is worth roughly $400.
Yield testing also fixes a costing error most kitchens carry. If your recipe costs use the as-purchased price rather than the edible-pound price, every plate is underpriced by the trim, and no amount of menu work will find it.
Batch sizing is the other half. Batches should be built to the demand you actually see on that day of the week, not to the size of the pot. Worked number: a soup batched a gallon larger than it sells, four times a week, at an illustrative $12 a gallon of food cost, is $48 a week, about $200 a month.
Watch out: cutting batch size raises labor, because smaller batches mean more of them. Small-batch cooking is often right, but it is a trade, not a free win.
Step 6: Use the trim deliberately
Trim that cannot be prevented can sometimes be sold. Stocks from bones and vegetable ends, staff meal from usable offcuts, and specials built around a surplus are the three standard routes, and all three are real.
Stock is the clearest case. Bones, mirepoix ends and herb stems that would be binned become a base you would otherwise buy, so the saving is the purchase price of the stock you no longer order plus the waste you no longer generate. Staff meal is the second: feeding the team from usable trim converts a cost you were already carrying into a benefit people value.
Specials are the third and the most oversold. A special built to move a surplus works when the surplus is predictable and the special is planned into the menu, so the trim has a designed destination before it exists. It fails when it is improvised, because an unplanned special needs its own prep, its own labor and its own explanation to a server who has not tasted it, and the labor cost of the rescue routinely exceeds the value of what was rescued.
That is the honest caution on cross-utilisation generally. Cross-utilisation only works if it is designed into the menu, where one ingredient appears in several dishes by intention, so that whatever is left over on Tuesday has somewhere to go on Wednesday. Bolted on after the fact, it is a nice idea that costs more than it saves.
Watch out: what may be reused, how long it may be held, and how it must be cooled and reheated are food safety questions with jurisdiction-specific answers. Confirm the rules with your local health department before you build any reuse route into your prep list.

Step 7: Cut plate waste at the portion
Plate waste is the stream operators most often dismiss and the one that carries the clearest message, because a guest who leaves half a component has told you something specific and paid for the privilege.
The mechanics: for two weeks, have the dish pit note which components consistently come back and roughly how much. You do not need precision, you need a pattern. If the same side returns half eaten across dozens of covers, that is not dozens of unusual guests. That is a portion that is bigger than the dish needs.
Worked number: trimming a side portion from six ounces to five on a dish that sells 900 covers a month, where the side costs about $0.90 per six ounce portion, is $0.15 an ounce, so 900 ounces saved is about $135 a month. Do that on three components and the plate waste line moves meaningfully.
The judgement call is where value perception lives. Some components are the reason a guest feels the plate was worth it, and cutting those is a false economy that shows up in reviews and repeat visits before it shows up in food cost. Others are filler nobody notices. Cut the filler, protect the signature.
Plate waste is also menu feedback in the strict sense. A component that returns consistently might belong in a smaller portion, in a different pairing, or off the menu, and our walkthrough on how to price a restaurant menu covers how that decision interacts with what the dish contributes.
Watch out: never fix plate waste by reusing food that has been to a table. That is a food safety line, not an efficiency question.
Step 8: Hold the gains with a weekly waste log
Everything above reverts. Not sometimes, not in badly run kitchens, but by default, because the pressure of service is constant and the pressure to reduce waste ends the day the project ends. The only thing that holds a gain is measurement that continues.
The mechanics: keep the log permanently, but make it lighter than the measurement fortnight. Daily weighing at the two waste points, weekly totalling, and a single number that gets read aloud in the same meeting every week. One number, one trend line, one target.
Set the target in dollars, not in adjectives. In the illustrative restaurant, moving from $6,000 to $3,000 a month is a target anyone can check. Post it where the log lives so the person filling in the sheet can see what the sheet is for.
Give the number an owner. A log with no owner is a log that stops being filled in about three weeks after the manager who cared about it moves on. That is a hiring and role design question as much as an operations one, which our walkthrough on how to hire restaurant staff touches on when it comes to who carries a standing responsibility.
Watch out: do not tie the waste number to individual blame. The moment a cook believes a logged item costs them something personally, the log becomes fiction and you lose the only instrument you have. Review it as a kitchen system, and treat a rising number as information rather than an accusation.
Where the sales dollar goes when waste is visible
Zoom out to the whole sales dollar, because the point of separating waste from food cost is what it does to the picture. The stacked bar below splits the illustrative restaurant’s sales dollar into food that reached a guest, food that was wasted, labor, everything else, and what is left as profit. The five shares sum to 100.
Where the sales dollar goes with waste carved out of food cost
The illustrative restaurant's split of one sales dollar. The 32 cent food cost is shown as 26 cents of food sold and 6 cents of food wasted. Shares sum to 100.
The waste slice is three times the profit slice. Halving waste to 3 cents moves food cost to 29% and lifts profit from 2 cents to 5 cents, roughly $2,000 to $5,000 a month on $100,000 of sales, without a single new guest or a single price increase. All figures are illustrative.
Read the two charts together and the argument closes. The bars show that two thirds of the waste money was bought rather than created, so the largest fixes happen before the food is cooked. The stacked bar shows that the profit slice is thin enough for those dollars to be the difference between a restaurant that works and one that does not.
A worked example: one month end to end
Put the whole method through one month in the illustrative restaurant. Food sales of $100,000 across 4,000 covers. A 32% food cost, $32,000 of cost of goods sold. Fully loaded labor at $36,000, other operating costs at $30,000, and $2,000 of net profit.
Steps one and two: two weeks of weighing produce a monthly waste value of $6,000, split $2,700 spoilage, $2,100 prep and trim, $1,200 plate. Food cost is now readable as 26 points of food sold and 6 points of food wasted.
Step three, ordering and par levels: resetting pars on the produce list and the short-dated dairy items removes an illustrative $1,000 a month. Step four, receiving and storage: rejecting short-dated deliveries, enforcing rotation, labelling everything and running a weekly walk-in audit removes another $700. Step five, prep: yield testing the three highest-volume items is worth about $400 and honest batch sizing about $200, so $600. Step six, deliberate trim use through stock and staff meal, $200. Step seven, portion adjustments on three non-signature components, $400. Step eight, the log itself, $100 from the attention effect alone.
Total recovery: $1,000 plus $700 plus $600 plus $200 plus $400 plus $100 is $3,000 a month, exactly half the waste. Waste falls from 6% to 3% of sales, food cost falls from 32% to 29%, and net profit rises from $2,000 to $5,000 a month, $24,000 to $60,000 a year.
Two caveats keep this honest. The recovery is spread over two to three inventory periods, not one, because inventory on hand has to work through. And the labor to sustain it is real, so net the hours against the dollars before you celebrate. Run your own version in the calculator.
What each fix is worth
It is worth stating the recovery figures on their own, because their ranking is more useful than their totals. Ordering and par levels lead at an illustrative $1,000 a month, receiving and storage follow at $700, prep yields and batch sizing at $600, portion adjustments at $400, deliberate trim use at $200, and the log itself at $100.
The ranking is not an accident. It tracks the order in which food moves through the building, and money is easiest to save at the earliest point, because every later step adds labor and handling to food that was already doomed. A case that should never have been ordered costs you the case. The same case, received, stored, prepped and then binned, costs you the case plus every hour that touched it.
That is the argument for working the steps in sequence rather than picking the one that feels most satisfying. Portion control is visible and gratifying and it sits sixth on this list for a reason. Yield testing is the fashionable answer and it is worth less than resetting a par sheet that nobody has questioned in two years.
It also explains why the last item is worth anything at all. The $100 attributed to the log is not a mechanism, it is attention: things that get weighed get handled differently. That effect is real and it is also the first thing to disappear when the weighing stops, which is why the log is a permanent fixture rather than a phase of the project.
Equipment as a waste lever
Sometimes the constraint is genuinely the equipment, and the waste log is what tells you whether it is. If produce and dairy spoil in a walk-in that holds temperature reliably and still has room for air to move, the equipment is fine and the problem is upstream in ordering or rotation. If the unit cycles warm, is packed past the point of airflow, or is small enough that staff store product where it does not belong, the equipment is the constraint.
The test is arithmetic rather than preference. Take the spoilage dollars your log attributes to the affected storage, estimate honestly what share a capable unit would remove, and compare the annual saving to the installed cost. A unit that removes $500 a month of measured spoilage returns $6,000 a year, and whether that justifies the spend depends on the price, the install, and the energy and maintenance it brings with it.
Two cautions. First, do not credit the equipment with waste it cannot touch: a new cooler removes nothing from your plate waste or your over-prepped batches. Second, the operating costs are part of the comparison, not a footnote, and a machine that runs constantly has an energy line that eats into the saving.
For the purchase side of that decision our teardowns on commercial refrigerator cost and commercial freezer cost work through what drives the number, and holding and monitoring requirements should come from your local health authority rather than from any general figure.
The food safety line you should not cross alone
Waste reduction has a hard boundary, and it is worth naming plainly because the pressure to save food pushes directly against it. Holding times, cooling procedures, reheating rules, date labelling, allergen handling and what may be reused after service are all food safety questions governed by rules that vary by jurisdiction, by product and sometimes by the type of establishment.
This article does not state those rules and no article should. Get them from your local health department, your state or provincial food safety authority, or a certified food safety programme, and get them in writing for your own operation. A saving that comes from stretching a holding time is not a saving, it is a risk transfer onto your guests and your licence.
The practical posture is that food safety sets the boundary and waste reduction operates inside it. Every technique in this walkthrough is designed to work that way: better ordering means less food ages, better rotation means less food reaches its limit, better batching means less food is held at all. None of them require holding anything longer than your rules allow.
Where a technique looks like it might touch the line, treat that as a signal to ask rather than to decide. Reusing a component, cooling a large batch, or extending a prep item’s life are all reasonable questions with jurisdiction-specific answers, and the person to ask is your health inspector, who would generally rather answer a question than write a citation.

Donation and diversion as a route, not a promise
Surplus that is still safe and has not been served is sometimes eligible for donation, and many operators route it that way. It is worth investigating, and it is worth being precise about what it does and does not do.
What it does not do is recover the money. You already paid for the food. Donation changes where it goes after the loss has been incurred, so it belongs alongside the prevention steps rather than in place of them. The dollars in this article come from not buying the food, not from disposing of it differently.
What it may do is reduce disposal costs, use surplus that would otherwise be destroyed, and serve a purpose the operator cares about. Whether a given item is eligible, how it must be packaged, cooled and transported, who may receive it, and what liability protections exist are all governed by rules that vary by jurisdiction and change over time. Treat any general claim about donation liability, including a reassuring one, as something to verify rather than rely on.
The route to check is straightforward: contact your local health department for the handling rules that apply to you, and contact any prospective receiving organisation for what they can actually accept and collect. Composting and organics diversion sit in the same category, governed by local waste rules and by what your hauler offers. Both are worth exploring, and neither substitutes for the log.
Waste and the prime cost trade
Food and labor together are prime cost, and waste reduction sits awkwardly across both, so it is worth being explicit about the trade rather than pretending it does not exist.
In the illustrative restaurant, food at 32% and fully loaded labor at 36% make a 68% prime cost. Cutting waste by three points takes food to 29% and prime cost to 65%, which is the single largest structural improvement available without touching a price or a headcount. That is the case for doing it.
The complication is that some of the techniques add hours. Smaller batches mean more batches. Tighter pars mean more frequent ordering and more receiving. Yield testing takes bench time. Logging takes ten minutes a day across two stations, roughly five hours a month. At an illustrative fully loaded rate of $21.60 an hour, five hours is about $110 a month, which is comfortably covered by a $3,000 recovery but is not zero.
Some techniques go the other way and save labor too. Not prepping food you will bin removes the prep hour as well as the food cost. Not receiving and storing a case you did not need removes the handling. The net is usually favourable, but you should calculate it rather than assume it, which is what our breakdown of restaurant labor cost percentage is for.
Common mistakes when cutting food waste
Six mistakes account for most failed waste programmes, and every one of them is avoidable:
- Changing before measuring. Without a baseline you cannot tell whether anything worked, and you will fix the stream that is most visible rather than the one that is most expensive.
- Valuing waste at menu price. A binned portion cost you what you paid for the ingredients, not what you would have charged. Menu-price valuation inflates the number, and an inflated number gets dismissed as soon as someone checks it.
- Treating all waste as one problem. Spoilage, prep waste and plate waste need three different fixes. A general instruction to waste less is not a fix and produces no measurable change.
- Improvising specials to rescue surplus. Unplanned cross-utilisation usually costs more in labor and confusion than the food it saves. Design ingredient overlap into the menu instead.
- Using the log for discipline. The moment logging carries personal consequences, the log becomes fiction and you have lost your only instrument.
- Stopping when the number improves. Waste reverts. The programme is the permanent log and the weekly target, not the fortnight of measurement that started it.
A seventh worth naming: assuming equipment is the answer before the log says so. New refrigeration is a satisfying purchase and it removes nothing from a stream it does not touch.
Troubleshooting: what if the number will not move
What if the log total is flat after a month of changes? Check the coding first. Waste often shifts between streams before it falls, so a par level fix can reduce spoilage while a simultaneous batching change raises prep waste, leaving the total unchanged and hiding two real movements. Read the three streams separately before you conclude nothing happened.
What if waste falls but food cost percentage does not? That is usually timing rather than failure. Inventory already on hand has to work through before purchasing changes reach cost of goods sold, so expect two full periods before the percentage confirms what the log is showing. If three periods pass with no movement, recheck your inventory counts, because a miscount on either end distorts the percentage regardless of what happens in the kitchen.
What if one stream is stubborn? Take the single largest line item in it and work only that one for a month. A stubborn total usually hides one dominant cause, and general effort spread across a category rarely finds it.
What if staff engagement fades? That is the normal course, not a failure of character. Shorten the log rather than abandoning it, keep the weekly reading in a meeting that already happens, and give the number a named owner. A lighter log that survives beats a thorough one that stops.
What if the waste is genuinely low already? Then say so, keep the log at minimum effort, and spend the attention on labor or on menu mix instead. Not every kitchen’s biggest leak is food, and the point of measuring is to find out where yours is.
Your food waste checklist
Save this compact list and work it in order:
- Scales at the prep bench and the dish pit, with a tared bin at each.
- A four-column log on a clipboard within arm's reach of each bin: item, weight, stream, reason.
- Two full weeks of measurement with no changes made, valued at purchase cost.
- The total split into three streams: spoilage, prep and trim, plate waste.
- Par levels reset against actual usage for every high-spoilage item.
- Receiving standard set: temperature checked, dates checked, short-dated deliveries refused.
- Rotation and labelling enforced, plus a weekly walk-in audit feeding a list to whoever orders.
- Yield tests run on the three highest-volume items, with recipe costs rebuilt on edible-pound cost.
- Batch sizes rebuilt to actual demand by day of week, not to the size of the pot.
- Trim routes designed into the menu: stock, staff meal, and only planned specials.
- Portions reviewed on the components that consistently come back, protecting the signature items.
- A permanent weekly log, a dollar target on the wall, and a named owner for the number.
- Every food safety question routed to your local health department rather than decided in-house.
The bottom line
Cutting restaurant food waste is not a virtue exercise and it is not a separate initiative bolted onto operations. It is the operational half of the food cost percentage you already look at every period. A restaurant reading a 32% food cost with waste worth 6% of sales is not running an expensive kitchen, it is running a 26% kitchen and binning the difference, and the six points are recoverable without repricing a single dish or persuading a single new guest to walk through the door.
The order is what makes it work. Measure for two weeks before touching anything. Split the total into spoilage, prep and trim, and plate waste, because those three need three different fixes. Then work them in the sequence food moves through the building: ordering, storage, prep, deliberate use of trim, portions. Then keep the log, because the one thing every failed waste programme has in common is that the weighing stopped.
The arithmetic is the reason to bother. At an illustrative 2% net margin, recovering $3,000 a month of waste does what $150,000 of extra monthly sales would do, and it does it with the guests you already have. Run your own numbers in the companion calculator, keep every figure here as an illustrative starting shape rather than a benchmark, and let your own two weeks of weighing tell you where your money is actually going.
This walkthrough is educational material for restaurant owners and kitchen managers, not financial, legal, or food safety advice, and it recommends no supplier, hauler, donation partner, or software. Every sales figure, waste value, stream share, yield percentage, and recovery estimate above is an illustrative planning shape chosen to make the arithmetic legible, and your own totals will come from your own scale, your own invoices, and your own inventory counts. Holding times, cooling and reheating procedures, date labelling, reuse limits, donation eligibility, and organics diversion requirements are set by authorities that differ by jurisdiction and change over time, so confirm every one of them with your local health department before you act on anything here. Weigh first, split the total into its three streams, fix the largest one, and keep counting after it improves.
Frequently asked questions
How do you reduce food waste in a restaurant?
You reduce restaurant food waste by measuring it before you change anything, then fixing the causes in the order they occur: ordering and par levels, receiving and storage, prep yields and batch sizing, deliberate use of trim, and finally portion size on the plate. Measuring first matters because most kitchens guess wrong about which stream is largest, and the fix for spoilage is completely different from the fix for plate waste. In an illustrative restaurant with $100,000 of monthly food sales and $6,000 of monthly waste, roughly 45% of the waste value sits in spoilage, 35% in prep and trim, and 20% in food returned from the dining room. Those shares are illustrative rather than benchmarks, and your own two weeks of weighing will tell you where your money actually goes.
How much does food waste cost a restaurant?
The honest answer is that it costs whatever your own waste log says, because there is no reliable universal figure and the range across kitchens is enormous. What you can do is convert it into a number that means something on your profit and loss. In an illustrative restaurant doing $100,000 in monthly food sales at a 32% food cost, waste worth 6% of sales is $6,000 a month, or about $1.50 for every one of 4,000 covers, and about 19 cents of every dollar of food purchased. Against an illustrative 2% net margin, that $6,000 is three times the restaurant's entire monthly profit, which is the reason the waste log earns its place.
Is food waste already included in my food cost percentage?
Yes, and that is the single most useful thing to understand about it. Food cost percentage is calculated from cost of goods sold, which is beginning inventory plus purchases minus ending inventory, so anything that left your inventory without being sold is already sitting in the numerator. A restaurant reading a 32% food cost with waste worth 6% of sales is really running a 26% food cost badly rather than a 32% food cost well. Splitting the number that way changes what you do about it, because the six points are an operational problem you can fix without touching a single menu price.
What should a restaurant waste log record?
A useful waste log records four fields for every entry: the item, the weight or count, which of the three streams it came from (spoilage, prep and trim, or plate waste), and a one-word reason such as over-ordered, over-prepped, mishandled, or returned. Value it at what you paid rather than at menu price, because the dollar you lost is the purchase cost, not the sale you never made. Keep the sheet on a clipboard beside the bin rather than in an office, because a log that requires a walk does not get filled in. Total it weekly, chart the trend, and review it in the same meeting every week so it becomes a habit rather than a project.
Why is removing waste worth more than adding sales?
Because a dollar of waste removed is a dollar of cost removed, and a dollar of cost removed is a dollar of profit, while a dollar of new sales only delivers profit at your net margin. In an illustrative restaurant running a 2% net margin, recovering $3,000 a month of waste is worth the same as adding $150,000 a month in sales, which would be two and a half times the restaurant's existing volume. Even at a healthier illustrative 5% margin you would need $60,000 of extra monthly sales to match it. The caveat is that removing waste is not literally free: tighter ordering, yield testing and logging all consume labor hours, so net the recovery against the time it takes.
How long does it take to see results from cutting food waste?
Measurement takes about two weeks before it is worth acting on, because a single week can be distorted by one bad delivery or one slow Tuesday. Ordering and par level changes usually show up in the next full inventory period, since they change what comes through the door. Prep and portioning changes show up faster in the waste log itself but take longer to reach the food cost percentage, because inventory on hand has to work through first. Expect a readable trend in the log within a month and a readable movement in food cost percentage within two full periods, and treat anything faster than that as noise rather than proof.
Can I donate surplus food instead of throwing it out?
Donation is a legitimate route for surplus that is still safe and unserved, and many operators use it, but the rules around what may be donated, how it must be handled and transported, and what liability protections apply vary by jurisdiction and by the type of food. Treat it as a route to investigate rather than a settled legal position: contact your local health department and any prospective receiving organization before you build it into your process. Donation also does not reduce the cost you already incurred, so it belongs alongside the prevention steps rather than instead of them. The dollars come back from not buying the food in the first place.
Does better refrigeration actually reduce spoilage?
It can, but only when temperature or capacity is genuinely the cause, which is why the waste log comes first. If your log shows produce and dairy spoiling in the walk-in while the unit holds temperature and has room to spare, the problem is ordering or rotation and a new compressor fixes nothing. If the unit cycles warm, is packed past the point where air can move, or forces staff to store product where it does not belong, then equipment is the constraint and the payback is calculable against the spoilage line you measured. Holding temperatures and monitoring requirements are set by your local health authority, so confirm the standards that apply to you rather than assuming a number you read somewhere.